October 2023 - The Bond market gives investors a High Five
by Stephen Bennie 2023-10-30


I’m sure I’m not the only person whose eyes tend to glaze over at talk of an inverted yield curve or what’s happening with the pricing of 2-year break evens. But big things have been happening in bond land in recent weeks which I thought merited some discussion, albeit by a non-expert.
Taking a step back, bonds are in essence a simple investment. You lend to an entity, generally a country or a corporate, some money for typically a set number of years, during which time you will be paid interest until maturity (the end of the agreed period) at which point you should get your original loan back. The two main variables of the deal between lender and borrower are the number of years and the amount of interest paid. The other pertinent aspect of the deal is how creditworthy the borrower is.
So far, hopefully, so good. If you buy and hold a bond to maturity, you get exactly what was agreed to on day one, all going to plan. However, if you decide to sell before maturity, you may find that you make a gain, or a loss, on your bond, as it gets “marked to market”. If interest rates have moved lower, you will make a gain, as your interest rate is better, this gain is amplified by the number of years, duration, still left by that higher interest rate, the more years the merrier. The flipside is true of rising interest rates, which will mean a loss and again the greater the duration the greater the loss. These fluctuations are referred to as interest rate risk.
The other factor which could come into play, is that the borrower experiences trouble and investors worry about it being able to repay the loan. Frankly this risk, called credit risk, only has a major impact on the price of a bond when it looks like the borrower may not be able to pay you back at all. Investors tend not to lend to people they doubt can repay them. Sometimes it just turns out that you lent to the wrong people and that can, at its worst, make your bond worthless.
One of the biggest and most important borrowers in the world is the United States Treasury. They issue a lot of bills, notes and bonds with a variety of terms, from a one-month term to a 30 year term and many points in between. Once issued these loans are “marked to market” which means that you can plot the current interest rates of all their issued debt and create a yield curve for every day of the year. This yield curve will change through time solely due to moves in interest rate expectations, credit risk doesn’t really factor into the pricing of US Treasuries, given the United States isn’t going bust any time soon.
Three recent snapshots of the US Yield Curve

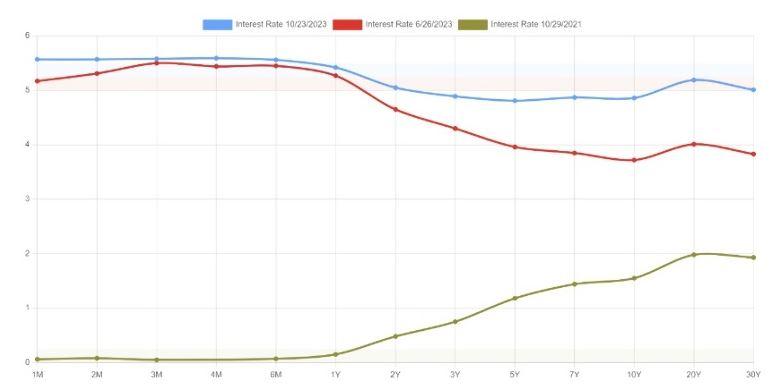
Source: ustreasuryyieldcurve.com
These three snapshots of the US Yield curve show three very different outlooks by the bond market. Back in October 2021 the green yield curve saw no chance of inflation and the need for higher interest rates. That of course turned out to be a major misjudgement. The yield curve predicted low interest rates for decades ahead.
For reasons I only partially understand, the bond market puts a great deal of emphasis on the spread between the 2 Year interest rate and the 10 Year interest rate. When, as it was in October 2021, the 10 Year interest rate is higher than the 2 Year the yield curve is positive, and this is viewed as a normal state of affairs. This makes sense too, the longer you tie in your capital to a deal the greater your compensation or interest rate should be. Hence the green yield curve above slopes upward from left to right: a positive yield curve.
The red yield curve is the dreaded inverted. As recently as June this year we have the market pricing longer term bonds at lower interest rates than the shorter end of the yield curve. This yield curve slopes downward from left to right, an inversion of the normal upward slope. The difference between the 2 year and the 10 year has gone negative. The narrative that this situation makes most sense in, is that a recession is seen as imminent, and that the Federal Reserve will have to cut the official cash rate in an attempt to stimulate an economic recovery. This inversion prevailed for most of this year to date, a gloomy recessionary outlook for investors.
Last, and far from least, is the most recent blue yield curve from this October. In, for bond investors at least, a dramatic move has occurred in the US yield curve. Suddenly the yield curve has flattened out. For the first time in over 16 years the 10 Year Treasury traded at 5%; the “high five”. This move at the long end of the curve essentially flattened out the yield curve with all maturities from 1 month to 30 years trading at just above 5% or just below. This “high five” is a very interesting development, in as much as the recession signal has, for the time being at least, abruptly vanished. For equity markets this would be a net win, short term earnings should hold up better than they would in a recession however higher long term interest rates increase the cost of capital. My take is that avoiding a recession would be the dominant factor and that the investors take the glass half full approach and give the bond market a “high five”.
Share article:
Other Insights


February 2024 - Recent studies show that passive investing now outweighs active investing
Read more >Stay updated with Castle Point Funds.
Investments
Resources
Company

Castle Point Funds
Generator Britomart Place
Level 10, 11 Britomart Place
Britomart, Auckland 1010
PO Box 105889
Auckland 1143, New Zealand
E info@castlepointfunds.com
2024 Castle Point Funds, Inc. All rights reserved.
Privacy Policy