January 2023 - A closer look into the dark art of technical trading
by Stephen Bennie 2023-01-02

A few readers may have noticed that in recent weeks several investment industry publications and newsletters have been referencing a dominant down trend that prevailed over the S&P500 index in 2022. I thought it might be useful to have a closer look into this dominant downtrend and explain why it's been getting this recent attention.
In dozens of previous articles, we have looked to explore the benefits of being a long-term fundamental investor where the key to success, hopefully, is having a deep understanding of a business and its intrinsic value. The recent articles looking at the S&P 500 downtrend of 2022 are referencing technical analysis. This is a very different approach to investing, technical analysis does not look at company fundamentals, rather its focus is primarily on price charts.
Technical analysis is popular with traders because price charts are easy to access and are available for thousands of potential investments, ranging from equities to bonds and from currencies to commodities and beyond. Essentially using price charts gives a trader a great big universe to hunt for opportunities which is always attractive. But what is that they are doing that they hope to turn into a profit. Typically, they are searching for patterns that they believe can be used to predict future price movements.
Understandably, for many this is akin to swirling tea leaves around in the bottom of a porcelain cup at a psychic reading. However it has to be admitted that some of the basis for technical analysis has a little more substance. Take for example the Mona Lisa where Leonardo Da Vinci utilises the Fibonacci sequence to paint arguably the most perfect piece of art in history.
Picture showing the Fibonacci sequence in art

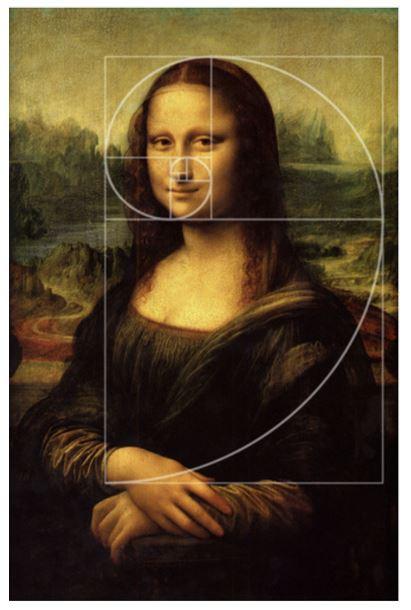
Source: Mona Lisa - The Fibonacci Sequence (weebly.com)
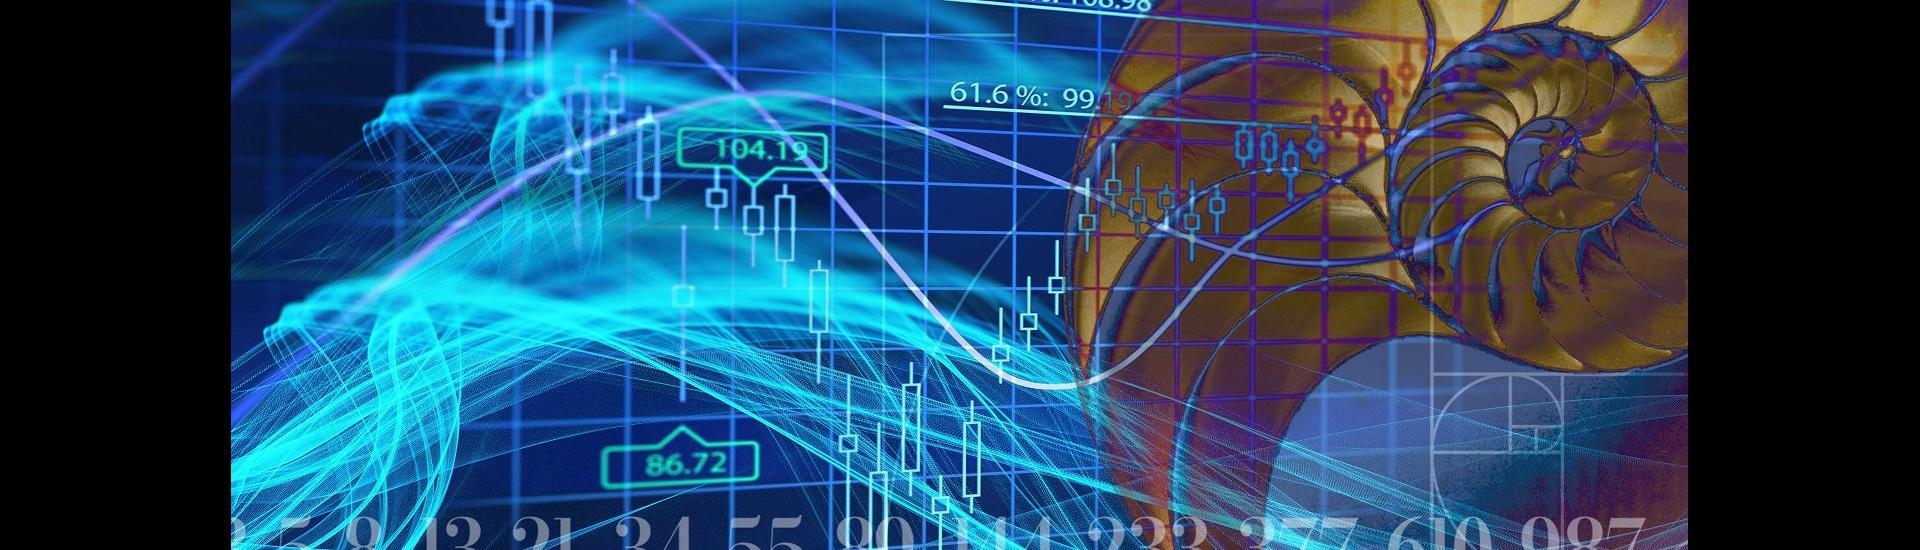
Although in evidence before Liber Abaci`, the work of mathematician Fibonacci (originally known as Leonardo de Pisa), in 1202, the sequence of numbers that also create the Golden ratio has become synonymous with Fibonacci. The Fibonacci sequence occurs frequently in nature too, for example flowers will have varying numbers of petals but the number will typically be a number on the Fibonacci sequence; 1,2,3,5,8,13,21. Of those numbers 3 and 5 are in bold for reasons that will be clear very soon.
Pictures showing Fibonacci numbers in nature


Source: Mona Lisa - The Fibonacci Sequence (weebly.com)
Using the Fibonacci sequence to predict future movements in markets became a focus of Ralph Nelson Elliott who developed the Elliott Wave theory in the 1930s. He found recurring patterns in price charts that often coincided with the Fibonacci sequence, particularly the 3 and 5, and the Golden ratio. That price charts can so often be broken down into patterns that follow Elliott Wave theory is uncanny and the only real explanation is that human nature, the emotions of fear and greed, at times very closely mirrors the patterns of nature and art. And given how emotional the markets were in 2022 its no major shock to see that a classic Elliott wave pattern can now be observed as the S&P 500 index was heavily sold off in a sequence of waves over the past 12 months.
Chart showing the dominant downtrend of 2022

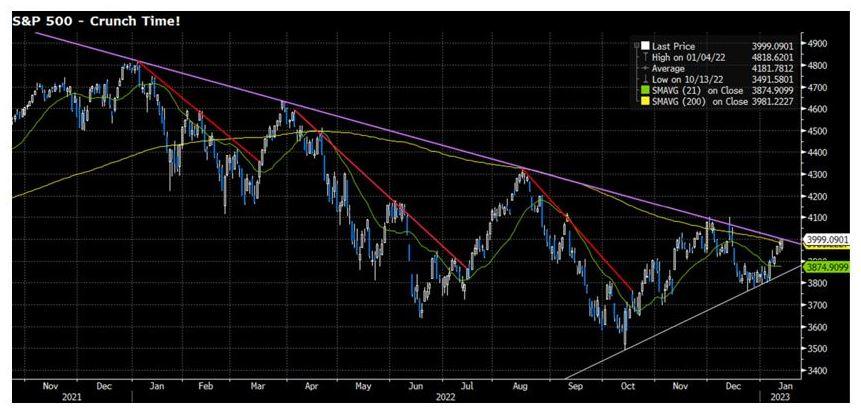
Source: Bloomberg & EAP
The chart above is an extract from a recent Evans and Partners market update. The red lines correlate with sell off waves 1, 3 & 5 with two wave rallies in between that were topped off by the purple resistance line. According to Elliott Wave theory a 5 wave move is followed by a 3 wave move called A, B & C. Now we come to the reason this spot of technical analysis has been getting a fair bit of airplay; the prediction of Elliott Wave theory would be that the S&P 500 index is currently in the process of forming a C wave that should, if it a genuine C wave, see it trade well above the purple resistance line. This would in turn signal a 5 wave move higher that would in theory see the US share market trade mainly positively for the next 6 to 12 months. However, a failure to break the dominant down trend would signal the potential for further market weakness. Hence the current news buzz around this piece of technical analysis.
This article is purely seeking to explain the interesting background to this chart and what it means to many investors. It is certainly not how we invest at Castle Point given we are long-term fundamental stock pickers. No one can be certain about why Fibonacci and Elliott Waves are so prevalent in markets perhaps it is human nature and those waves of fear and greed, or perhaps it’s just self-fulfilling. Either way it’s certainly an interesting phenomenon.
Share article:
Other Insights


February 2024 - Recent studies show that passive investing now outweighs active investing
Read more >Stay updated with Castle Point Funds.
Investments
Resources
Company

Castle Point Funds
Generator Britomart Place
Level 10, 11 Britomart Place
Britomart, Auckland 1010
PO Box 105889
Auckland 1143, New Zealand
E info@castlepointfunds.com
2024 Castle Point Funds, Inc. All rights reserved.
Privacy Policy